Monday 16 January 2017

QUAWLity- a new laboratory for research at Cape Bounty


As the research program has become more complex at Cape Bounty, we have needed increasingly sophisticated laboratory facilities and increased amounts of power in the lab.  This is not a trivial issue in a remote camp.  In the past we have made due with temporary lab tents and used a portable generator, but these conditions were less than ideal and the generators were noisy, need gasoline and ultimately can be unreliable.  This is the story of how we built our new lab facility, QUAWLity (Queen's University Arctic Watershed Laboratory).

With support from the Canadian Government Natural Sciences and Engineering Research Council (NSERC), QUAWLity moved from the drawing board to reality.  We shipped up the Weather Haven tent and arranged wood for the floor from a supplier in Resolute.  It all arrived in camp in early August 2015 and construction began.

The floor was first to be built.  We are not allowed to put in permanent foundations, so we placed the wooden floor on blocks and built it with insulation and linoleum to make it cleaner and warmer.


It was a group effort to build the tent.  Conditions were calm and foggy, perfect for handling the large tent pieces.  These tents are very well designed and have robust metal frames and vinyl covers that are suitable for long term exposure.  The tent went up quickly despite the dreary weather.


The construction crew, just before cutting the front door out.


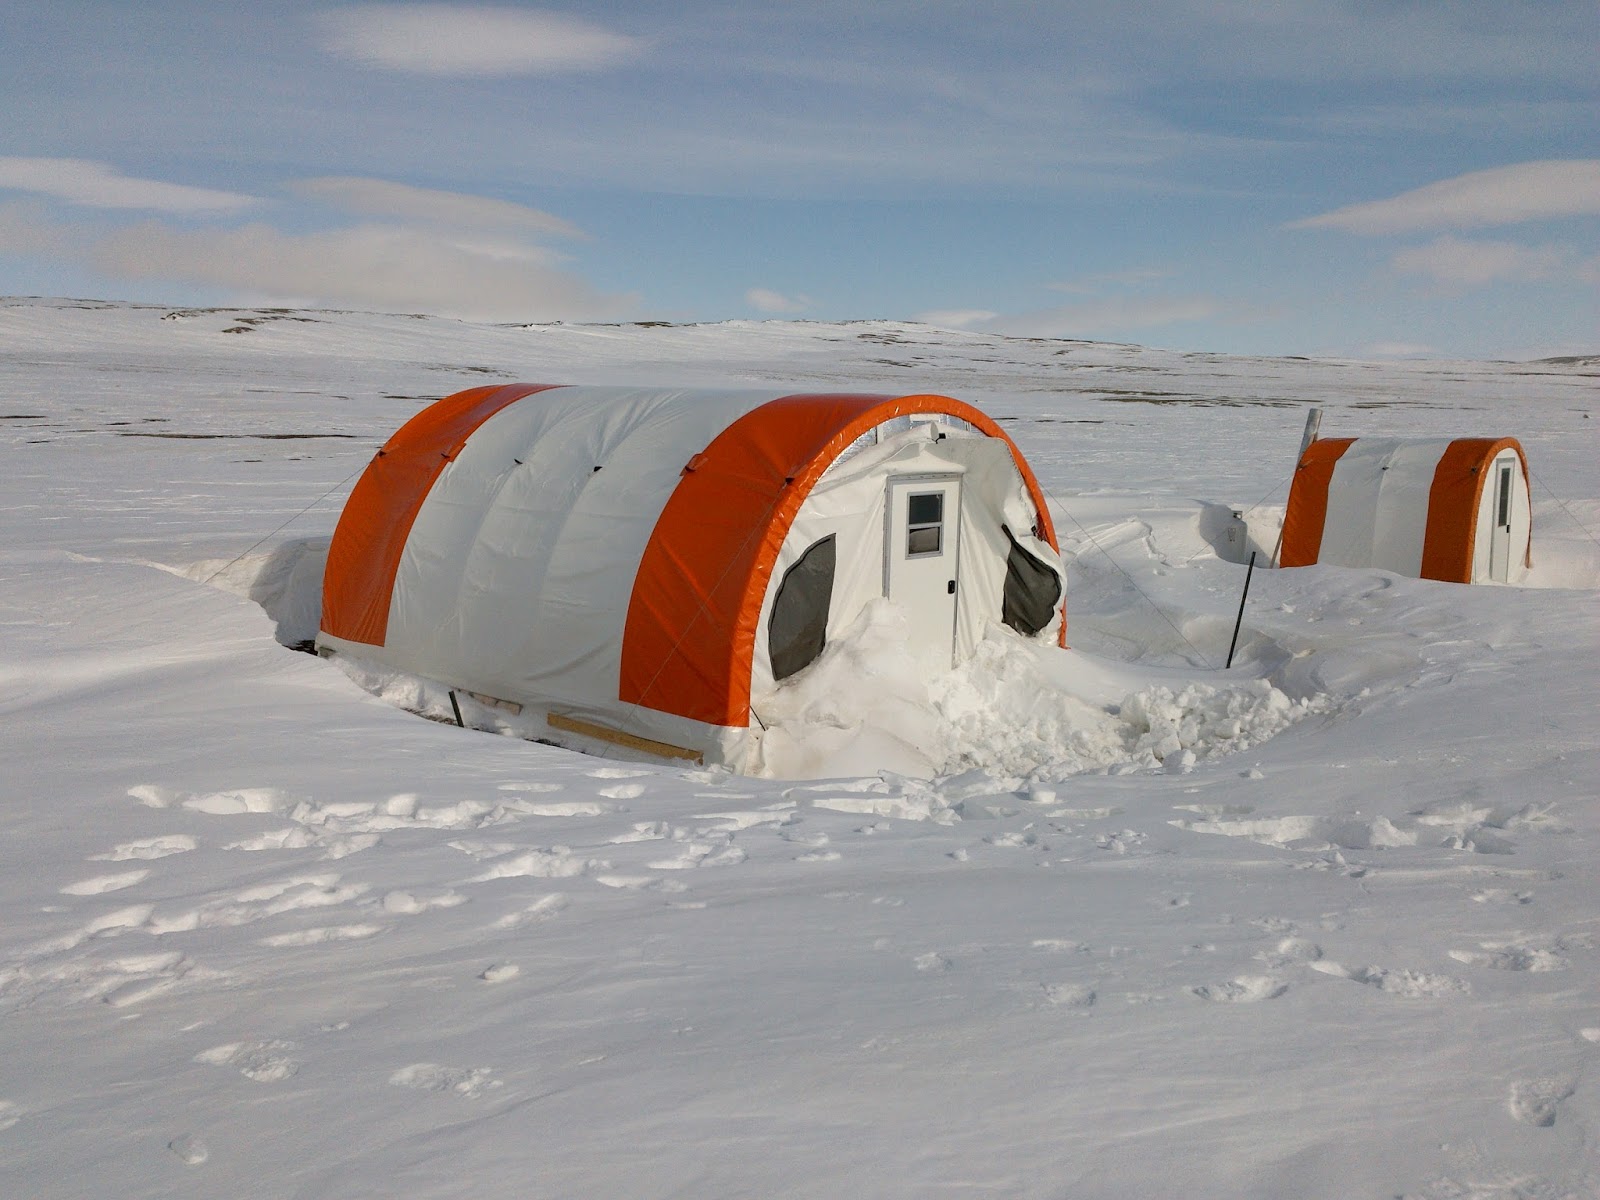
The finished tent, secured to the ground with long metal stakes and metal guy wires.


That was it for 2015, we left the tent empty until 2016.  Arriving in May, you never quite know what to expect, but other than a bit of loose material at the front, all well well.  These tents create large snow drifts, but the upwind side is usually bare of snow.


The first order of business was installing the propane wall furnace.  Dr. Benjamin Amann was eager to help!


We organized the lab into a series of workstations where sample filtering and handling could be carried out. The fume hood was a nice addition that allows safe handling of acids needed to stabilize some samples and a propane chest freezer means no more running the generator to keep the cooler frozen.


The last part of the set up was a solar system. Inside the tent are a panel for the electronics and a cooler for the AGM deep cycle batteries.  These batteries are designed not to freeze so they are safe to use in this setting and the cooler provides further protection from temperature extremes.  A temperature logger placed with the batteries showed that they stayed at -30degC or warmer, compared to almost -50degC outside at times.  They were fully charged when we arrived in mid-May


The 300W of solar panels are on a wooden frame outside, secured down with guy wires.  The orientation is perfect to have the wind scour the panels and keep them clear of snow in the winter. Even though we have 24-hour daylight during field seasons, the midnight sun does not charge our batteries!


After a full season in 2016, everything seems to be running well.  The lab tent is a clean, warm and spacious place to do our work and we really pushed it with a large field crew in 2016.  Everything worked to expectations, and the roller chairs really make life easier.  The solar system was sufficient to power everything so we are now officially free of generators for the lab.  It's all part of doing research 400 km from the nearest community in the remote High Arctic.

Monday 2 January 2017

Biogeochemical Research in the High Arctic

Hi! My name is Gillian and I’m a first-year Master’s student at Queen’s. Dr. Melissa Lafrenière, co-manager of the Queen’s Facility for Biogeochemical Research on Environmental Change and the Cryosphere (FABRECC: http://www.queensu.ca/geographyandplanning/fabrecc-lafreniere/home) is my supervisor. We are working to better understand biogeochemical processes at the Cape Bounty Arctic Watershed Observatory. In other words, we study the interactions between the physical, chemical, biological, and geological processes occurring in the High Arctic permafrost environment.
               
Specifically, I study carbon in organic matter. The permafrost of the Arctic stores huge amounts of organic carbon. In fact, researchers estimate that there is twice as much carbon stored in the permafrost as there is carbon in the atmosphere right now. As permafrost degrades due to warming temperatures, some of the permafrost carbon could be released to the atmosphere as greenhouse gases such as carbon dioxide and methane.

Why will only some of the carbon be released? Well, only a portion of the permafrost carbon is decomposable, and carbon must undergo decomposition to produce greenhouse gases. My job is to determine what makes the carbon decomposable and identify where the decomposable carbon is likely to be found on a High Arctic landscape.

Knowing how much carbon is decomposable, and where it’s located, is important for developing climate models. Because data on decomposable carbon are limited, carbon stored in permafrost isn’t well incorporated into current climate models. The results of our research could change that. For example, if we know there is a lot of decomposable carbon stored in areas highly susceptible to enhanced permafrost thaw, then we might conclude there is a high probability of greenhouse gas emissions in those areas. This increased probability can then be accounted for in climate model projections, making them more accurate.

A soil profile at one of my sampling sites at the Cape Bounty Arctic Watershed Observatory on Melville Island, NU.

I collected soil and water samples from sites with varying geomorphology and vegetation at Cape Bounty during the summer of 2016. Back in the lab at Queen’s, I incubated these samples for twenty-eight days. During an incubation, the samples were kept a constant temperature. At specific time points throughout the incubation period, I removed a subset (or aliquot) of each sample and analyzed it to characterize the molecular structure of its carbon compounds and its organic carbon concentration.

Now that the incubation period is finished, I can calculate how much organic carbon was lost (through decomposition) over the twenty-eight days. Better yet, I can compare these data with the molecular structure of the carbon compounds to see if molecular structure is an indicator of decomposability. If they are related, it would be really exciting since the methods used to characterize molecular structure are much easier to perform than the incubations. If molecular structures could be used to predict carbon decomposability instead of incubations, it would save researchers a lot of time and money!
An emission excitation matrix (EEM), like the one shown above, provides insight into the molecular structure of carbon compounds in water samples.
The next step for my project will be to look at how the decomposability of carbon varies by sample site. If we identify a relationship between carbon decomposability and study site characteristics, we could use this to predict how carbon decomposability will vary across the broader landscape. For example, if we find that carbon decomposability is related to a certain vegetation community, we could use vegetation cover maps to predict how carbon decomposability varies across the landscape.

               
The best part about my project is that I get to go back to Cape Bounty next summer for a second field season. So, based on what I find out from the lab work I’m doing now, I can tailor my 2017 sampling plan to better address my research questions. Stay tuned for more results and stories about field season preparations later this winter!